Features
Read your dashboard
A tour of the Revfaro dashboard, from the overview chart and its metrics to sources, pages, locations, devices, goals, filters and date ranges.
In short
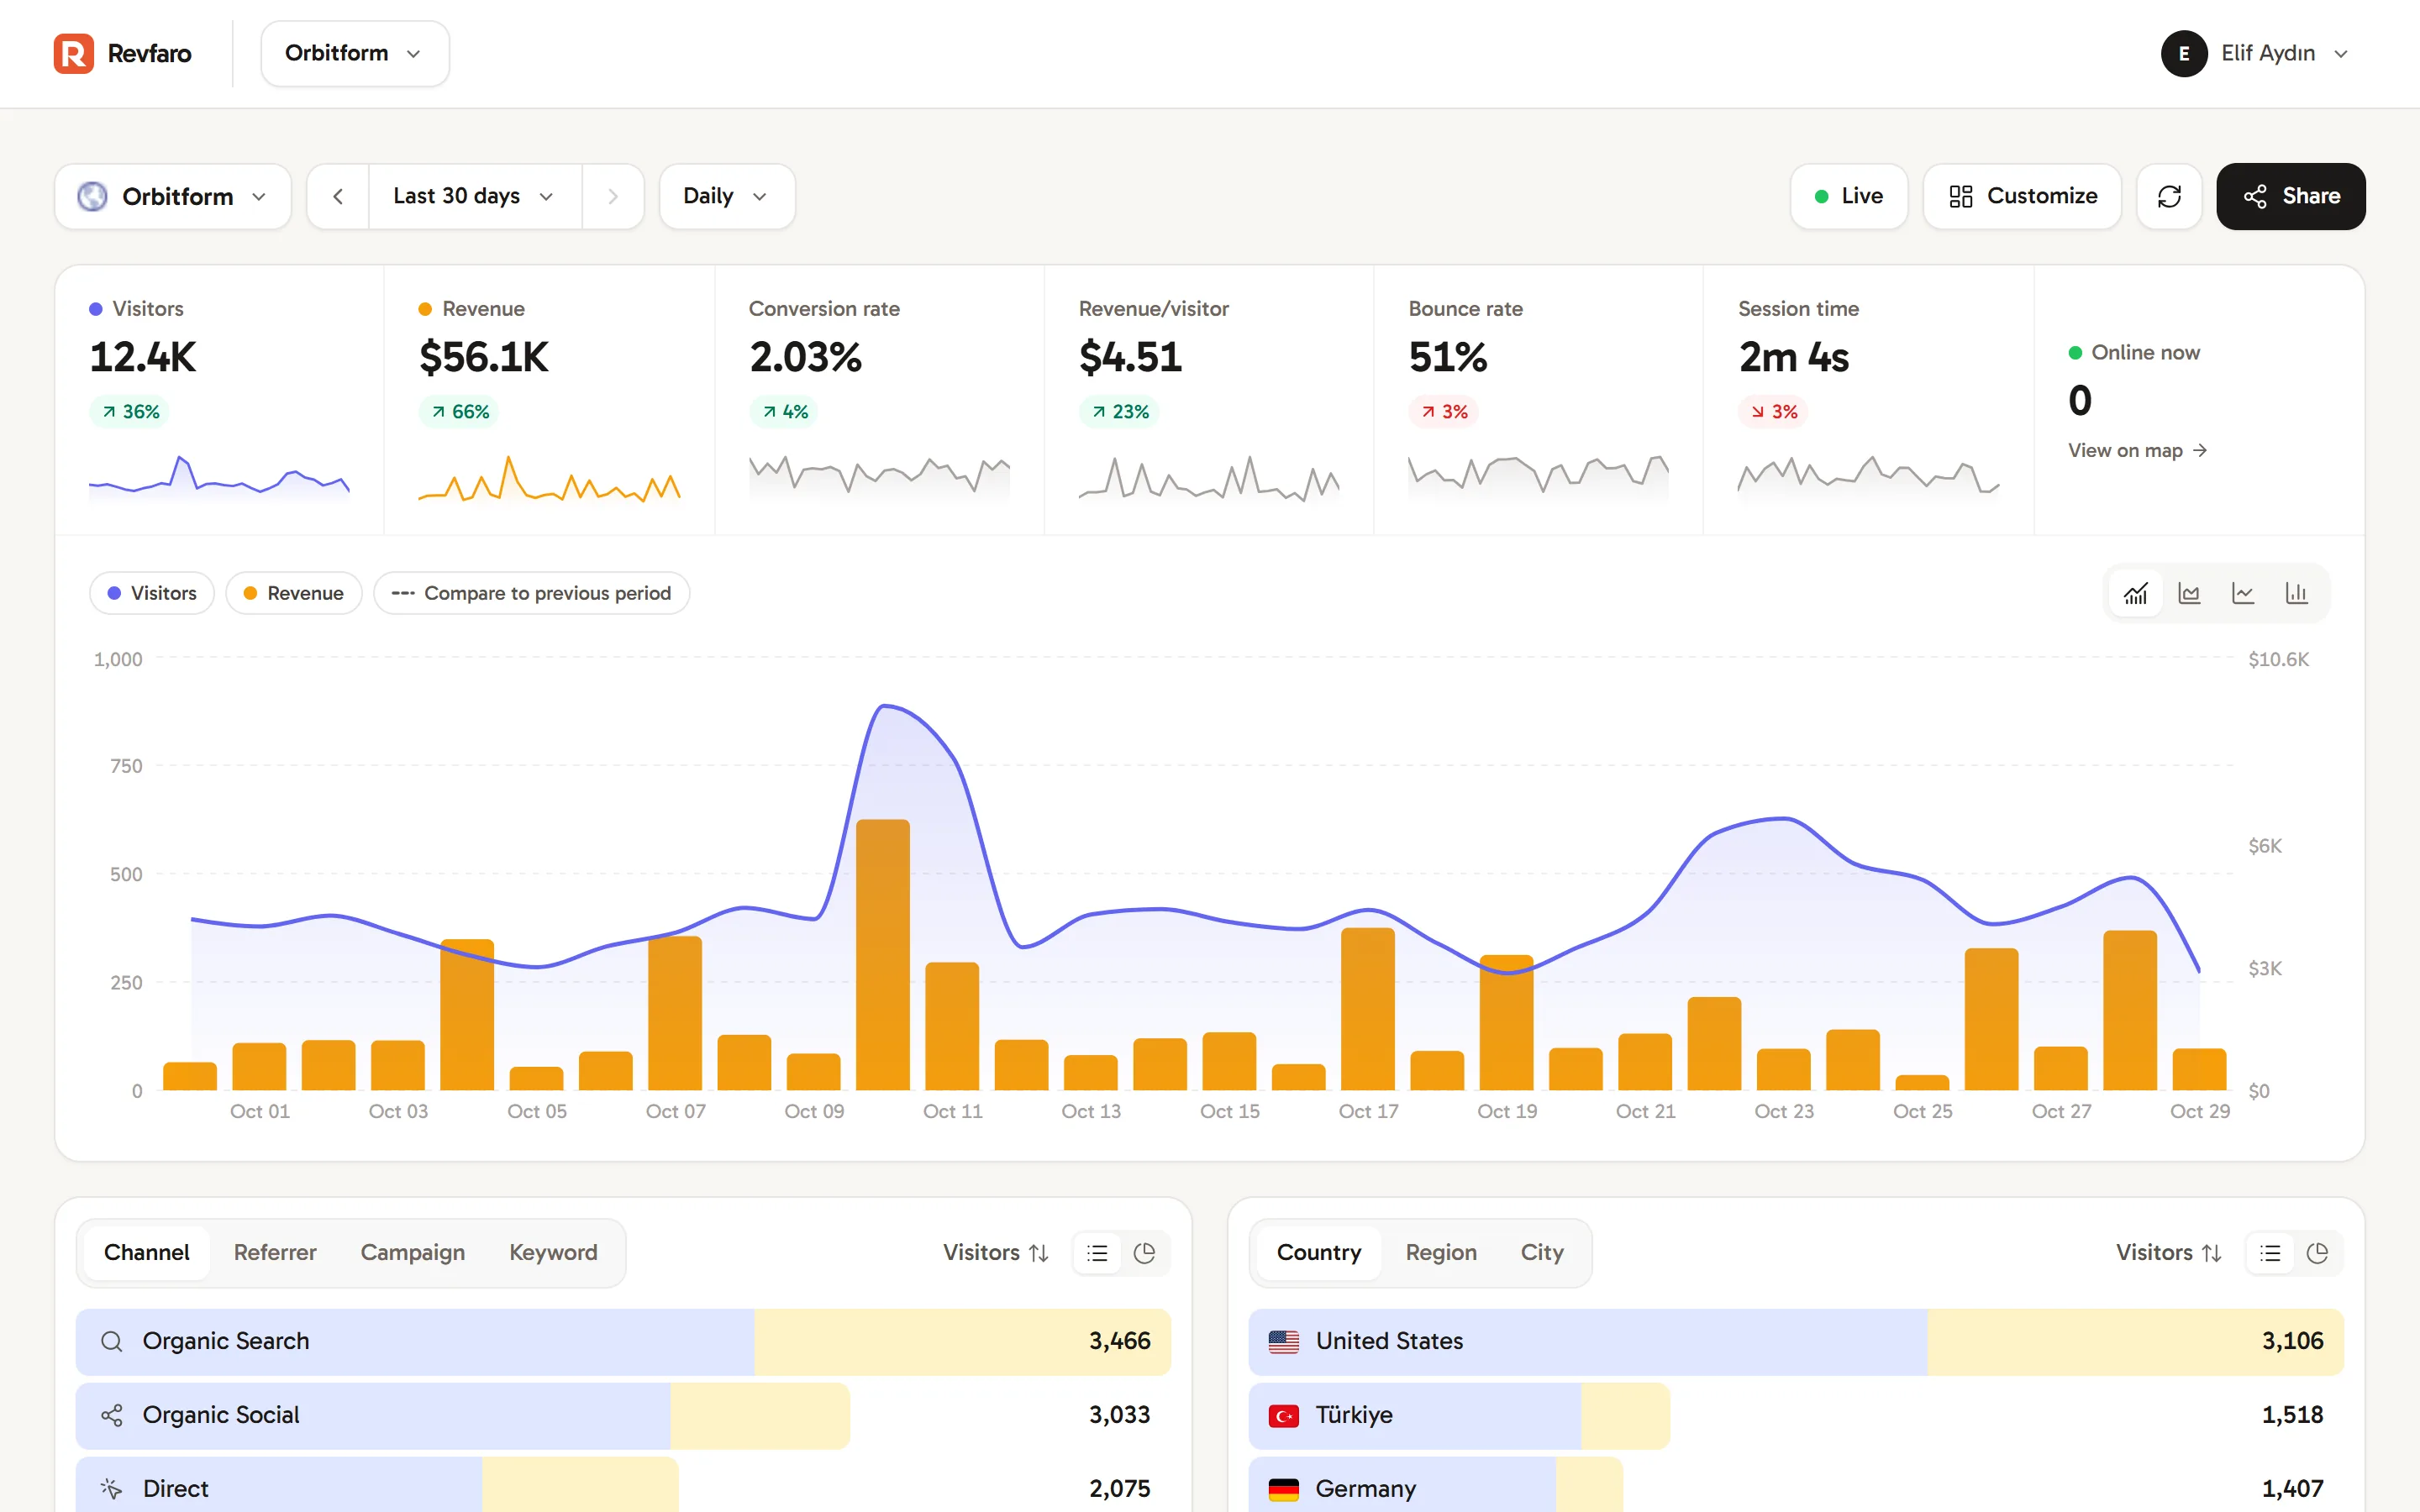
Each website has one dashboard. The overview at the top shows visitors and revenue over time with conversion rate, revenue per visitor, bounce rate and session time. Below it, cards break your traffic down by source, page, location and device, each with visitors and revenue side by side. Click any row to filter the whole dashboard by it, and pick a period at the top.
On this page
Open a website from Your websites to see its dashboard. Switch to another website with the website name in the top-left corner.
Choose a period
The period menu at the top offers Today, Yesterday, Last 24 hours, Last 2 days, Last 7 days, Last 30 days, Last 90 days, Last 12 months, All time and a Custom range. The arrows next to it step to the previous or next period of the same length. The menu beside it groups the chart Hourly, Daily, Weekly or Monthly.
The overview
The overview card compares the period with the one before it:
Today compares with the same hours yesterday. Calendar ranges such as Last 7 days start at midnight in the website's timezone and compare with the same local hours in the preceding range. Daylight-saving changes are handled in that timezone. Last 24 hours and Last 2 days use rolling windows of the same duration.
| Metric | Meaning |
|---|---|
| Visitors | Unique visitors in the period |
| Revenue | Payments minus refunds, in the website's revenue currency |
| Conversion rate | Share of visitors who became paying customers |
| Revenue/visitor | Revenue divided by visitors |
| Bounce rate | Share of visits that saw only one page |
| Session time | Average engaged time of a visit |
The chart shows visitors and revenue together. Hover over it to see each day, and pick a chart style: Bars and area, Area, Lines or Bars.
Revenue totals include only payments and refunds recorded in the website's revenue currency. Revfaro does not convert currencies. Other currencies stay in payment details and are excluded from totals; the dashboard shows a notice when the selected period includes them.
Add context with notes
Move over a date on the overview chart and click when Click to add a note appears to record a launch, campaign or other change. On mobile, tap the chart at the date you want. The editor starts with that date and uses the website's timezone. With the chart focused, use Left/Right or Home/End to choose a point, then Enter or Space to add a note.
Existing note markers open the notes for that date. Choose View next to Notes to search notes, review history or use the list's Add note button. The Notes toggle hides the markers for this website in your browser.
Notes are private to people who can access the website. Workspace owners, admins and website managers can add, edit and delete them; viewers can read them. See Chart notes for details.
Breakdown cards
| Card | Tabs |
|---|---|
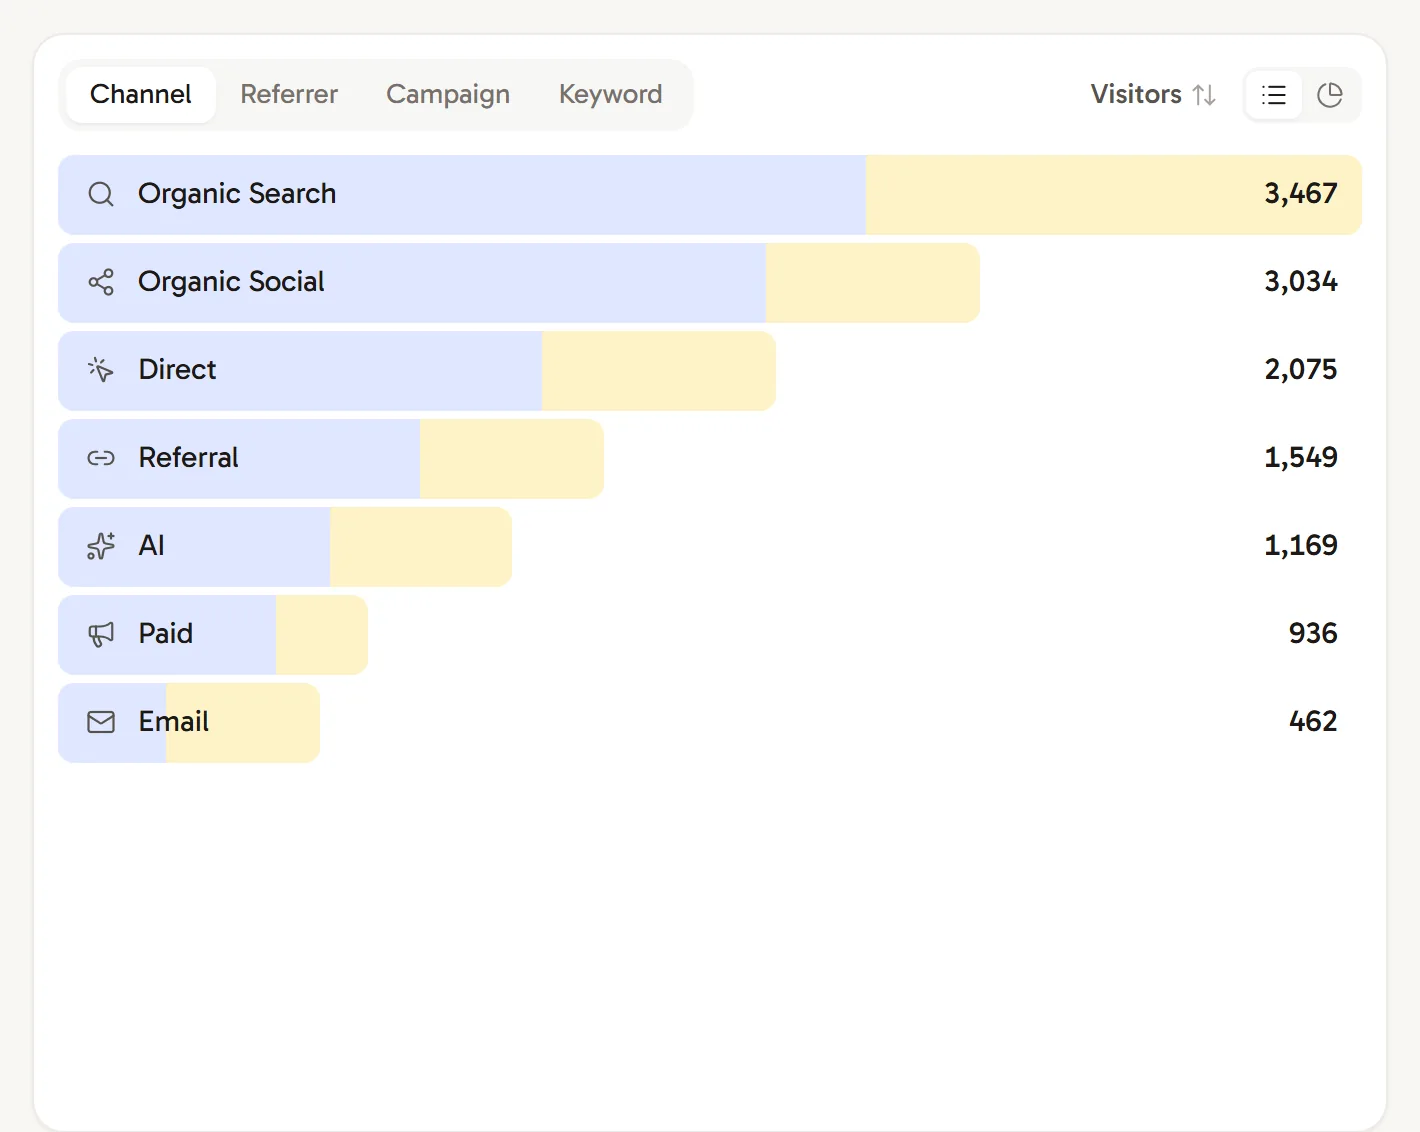
| Sources | Channel, Referrer, Campaign, Keyword |
| Pages | Page, Entry page, Exit link, Hostname |
| Locations | Country, Region, City |
| Technology | Browser, OS, Device |
| Conversions | Goals, Funnel, Users, Journey |
| Bot traffic | AI assistants, crawlers and search engines; see Bot traffic |
Every breakdown row shows visitors and revenue. Use the toggle in a card's header to sort by Visitors or Revenue, switch between List and Donut, and open the full list when there are more rows than fit.
Filter everything at once
Click a row in any card, such as Google in Referrer or Germany in Country, and the whole dashboard is filtered to the visitors it describes. Filters show as chips above the cards (for example "Referrer is Google"); combine several, remove one with its × or click Clear all.
Good questions to answer with filters:
- Which pages do visitors from ChatGPT land on? Filter Referrer by ChatGPT, then look at Entry page.
- Which countries convert best from a campaign? Filter Campaign, then sort Country by revenue.
- Where do buyers of your Pro plan come from? Click the goal in Goals to filter by the visitors who completed it.
Customize the layout
Click Customize at the top of the dashboard to arrange the cards your way:
- Move a card by dragging it by its handle.
- Resize it by dragging its right edge, or pick a width: ¼, ⅓, ½, ⅔ or Full width.
- Hide a card you don't need. Hidden cards are listed at the top under Hidden; click one to bring it back.
- Reset returns to the default layout, and Done leaves Customize mode.
Your layout is saved to your account and used on every website's dashboard. It doesn't change what your teammates see.
More on the dashboard
- Live opens the live view (or press M).
- Share creates share cards and embeds.
- The refresh button reloads the numbers.
- The bottom line shows the website's timezone and revenue currency, with a link to Settings & install for owners, admins and website managers.
Frequently asked questions
What is the conversion rate in Revfaro?
The share of visitors in the selected period who became paying customers. Goal conversion rates are shown separately in the Goals tab.
Which timezone does the dashboard use?
The website's timezone, set in Website settings › General. It is shown at the bottom of the dashboard with the revenue currency.
Why does my dashboard say it is locked?
The workspace has used its monthly events, or its trial or subscription has ended. Data is still collected when only the event limit is reached. See Plans, billing and usage limits.